Flow cytometry basics


1 Introduction
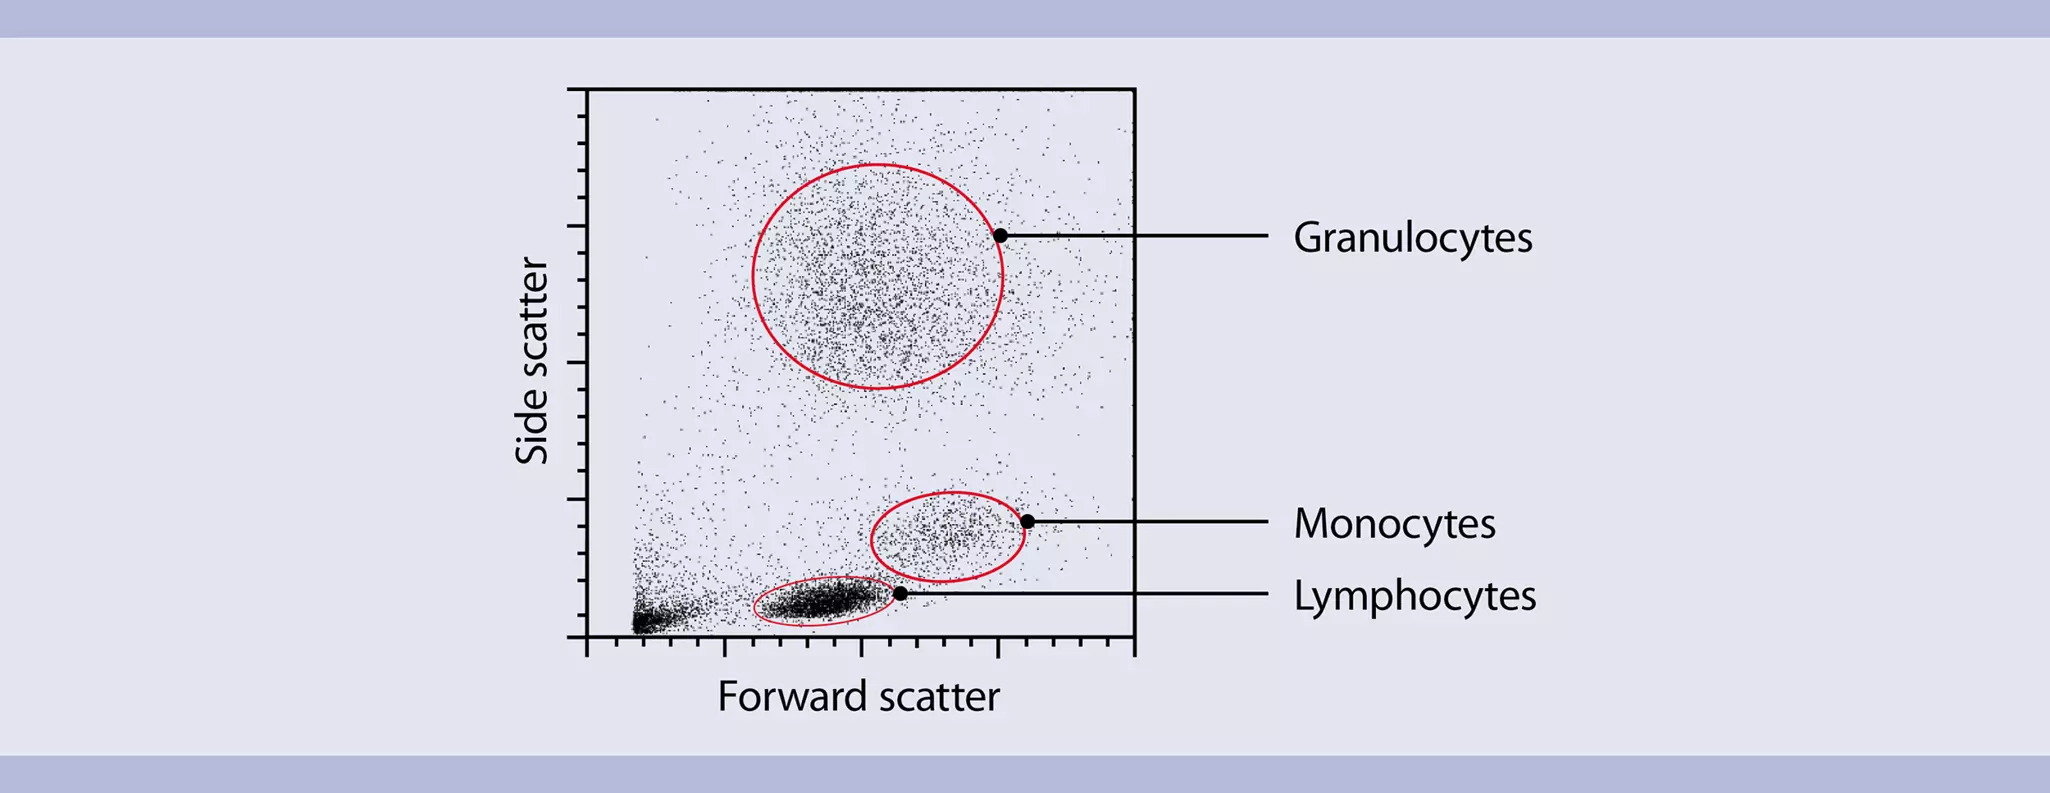
Flow cytometry is the measurement of chemical and physical properties of cells as they “flow” one by one through an integration point, most commonly a laser. As cells scatter laser light in different directions (forward or to the side), intrinsic cellular properties, such as relative cell size and cytoplasmic complexity, can be measured. In human whole blood, for example, lymphocytes, monocytes, and granulocytes can be distinguished simply because they scatter laser light differently.
 View details
Most modern flow cytometers can also measure extrinsic cellular properties, i.e., the expression of cell surface or intracellular markers, nucleic acid content, enzyme activity, and much more. To probe these cellular features, fluorescent reagents such as fluorochrome-conjugated antibodies are used. These reagents have characteristic light emission properties so that they can be detected separately in distinct fluorescence channels.
A unique attribute of flow cytometry is that fluorescence on a cellular or particle level can be measured very rapidly. As fluorescently labeled cells or particles travel through the light path, the fluorescent probes are excited. Detection of the emitted light and ultimately of the specific cellular properties occurs at a rate of 10,000 events/second.

Flow cytometry is used in both clinical and basic research. Many research fields benefit from this technology, including immunology, transplantation, hematology, neuroscience, stem cell research, cancer research, cell biology, molecular biology, drug discovery, systems biology, marine biology, microbiology, virology, and bioprocessing. Clinical applications are, among others, in vitro diagnostics, studies in the context of clinical trials, or monitoring patients after treatment. Some clinics also use flow cytometry to characterize donor and recipient cells prior to transplant to lower the risk of adverse effects following transplantation.
Examples of flow cytometry applications
- Multicolor immunophenotyping
- Cell viability assessment and apoptosis detection with PI and annexin-V conjugates
- Intracellular detection of cytokines and transcription factors
- Measurement of cytokine secretion by MACS® Cytokine Secretion Assays
- Cell cycle analysis using PI and or BrdU
- Microvesicle analysis
- Cell enumeration
- Measurement of calcium fluxes
- Detection of oxygen-reactive (H2DCFDA) and NO-reactive (DAF-FM diacetate) species
- Cell proliferation analysis with CFSE or CMFDA
- Fluorescent reporter protein detection – GFP, CYP, YFP, tdTomato, mCherry, RFP
- Analysis of virus particles, bacteria, mitochondria
 Related PDFs:
 Related products:
2 Components of a flow cytometer
MACSQuant® Flow Cytometers from Miltenyi Biotec are based on a system combining fluidics, optics, and electronics.
- Fluidics: a liquid flow system to align and move cells or particles through a laser path.
- Optics: a series of optical filters and mirrors to direct light of specific wavelengths emitted by cells or
particles towards detectors, which amplify the light signal. - Electronics: interface between optics and computer, converting the amplified light signals
proportionally into voltage, thus enabling graphical plotting.
2.1 The fluidics system
Hydrodynamic focusing is used to align and move the cells or particles through the laser path. The sheath fluid flows through the flow cell with constant pressure. Cells are injected into the middle of the sheath fluid flow. By principles of laminar flow, the cell sample and sheath fluid move in the same direction but stay separate. The pressure differential between the sheath and the cell sample determines how wide the sample stream is as it moves through the flow cell. Lasers excite the fluorescently labeled cells or particles individually and the scatter and fluorescence light are measured.

 View details
For flow applications that require very high resolution of certain cell populations, e.g., for cell cycle analysis, a low fluidic speed is recommended to generate a narrow sample stream. For general immunophenotyping applications, any fluidic speed is appropriate. It is important, however, that the event rate setting of the instrument does not exceed 10,000 events per second for any of the fluidic speeds.
2.2 The optical system
Filters and mirrors
After excitation by a laser, fluorescent reagents bound to cells or particles emit light, which is detected according to their specific wavelength range. When using a combination of fluorescent dyes, these reagents should have distinct emission spectra. MACSQuant Instruments utilize various optical filters and dichroic mirrors to direct light of specific wavelengths to the according fluorescence detectors. This arrangement creates the so-called fluorescence channels.
Different types of filters define which wavelengths can enter the fluorescence channels. According to their optical properties they are referred to as long-pass, short-pass, and band-pass filters. MACSQuant Instruments use long-pass and band-pass filters.

Long-pass filters are denoted by the letters LP and a specific number, e.g., LP 750. This means that light with a wavelength of 750 nm and longer can pass through the filter. Light of all other wavelengths will be blocked. Short-pass filters have a similar designation, e.g., SP 500. In that case, light of wavelengths of 500 nm and shorter can pass through, while the remaining light will be blocked. Band-pass filters allow light of a specific wavelength range to pass through. Band-pass filters are referred to as BP followed by two numbers. The first number represents the midpoint of the wavelength range. The second number specifies the wavelength range in nm that can pass. Thus, light that can pass through a BP 525/50 filter ranges from 500 to 550 nm.
Dichroic mirrors have essentially the same function as filters, but are oriented at a 45° angle to the light path, whereas filters are oriented perpendicular to the light path. The light that is not able to pass through a dichroic mirror is deflected at a 90° angle towards another light detector.
The optical systems of MACSQuant Flow Cytometers combine three lasers and various filters and mirrors, resulting in up to 14 distinct fluorescence channels and two scatter channels.
Photon detectors – Photomultiplier tubes (PMTs)
The light paths of specific wavelengths, i.e., fluorescence channels, are monitored by photomultiplier tubes (PMTs). PMTs amplify the fluorescence signal emitted from the fluorochrome bound to the cell or particle and generate an electrical current.
The magnitude of amplification is dependent on the voltage applied to each PMT. When the voltage is increased, the amplification of the detectable fluorescence is also increased, resulting in a higher mean fluorescence intensity (MFI). Conversely, when the voltage is decreased, the amplification is also decreased, resulting in a lower MFI. The electrical current generated by the PMT is converted into a voltage pulse within the electronics system.
2.3 The electronics
The electronics system of a flow cytometer converts the light signals into proportional electronic signals (voltage pulses), digitizes the signal according to the bit depth of the analog-to-digital converter (ADC), and interfaces with the computer for data transfer.
MACSQuant Instruments are digital flow cytometers, which means that the conversion from analog to digital signals happens at the point of signal detection and amplification. Advantages of digital flow cytometers include:
- Voltage pulse height, width, and area can all be a measurable parameter.
- Compensation of spectral overlap is applied after digital conversion of signal, meaning compensation can be re-adjusted any time post acquisition.
- Detection thresholds or triggers can be set on any of the detection channels.
- Fluorescence values detected as zero or negatives will be measured as such and can be displayed in the
plot choices.

Analog-to-digital conversion
Analog signals are converted into digital signals for display of data according to the ADC's bit depth. MACSQuant Instruments have a 16 bit ADC for all parameters. For the pulse area, an additional calculation allows for 18-bit processing. This means that for the pulse area measurements, the signals are resolved into over 253,000 bins. This enables a five-decade logarithmic scale for data display.
3 Visualization of flow cytometry data
3.1 Visualization of flow cytometry data
For data visualization, values of each measured optical parameter can be plotted in various ways. These plots can be univariate (histograms) or bivariate (dot plots).
Related products:
3.1.1 Univariate plots – histograms
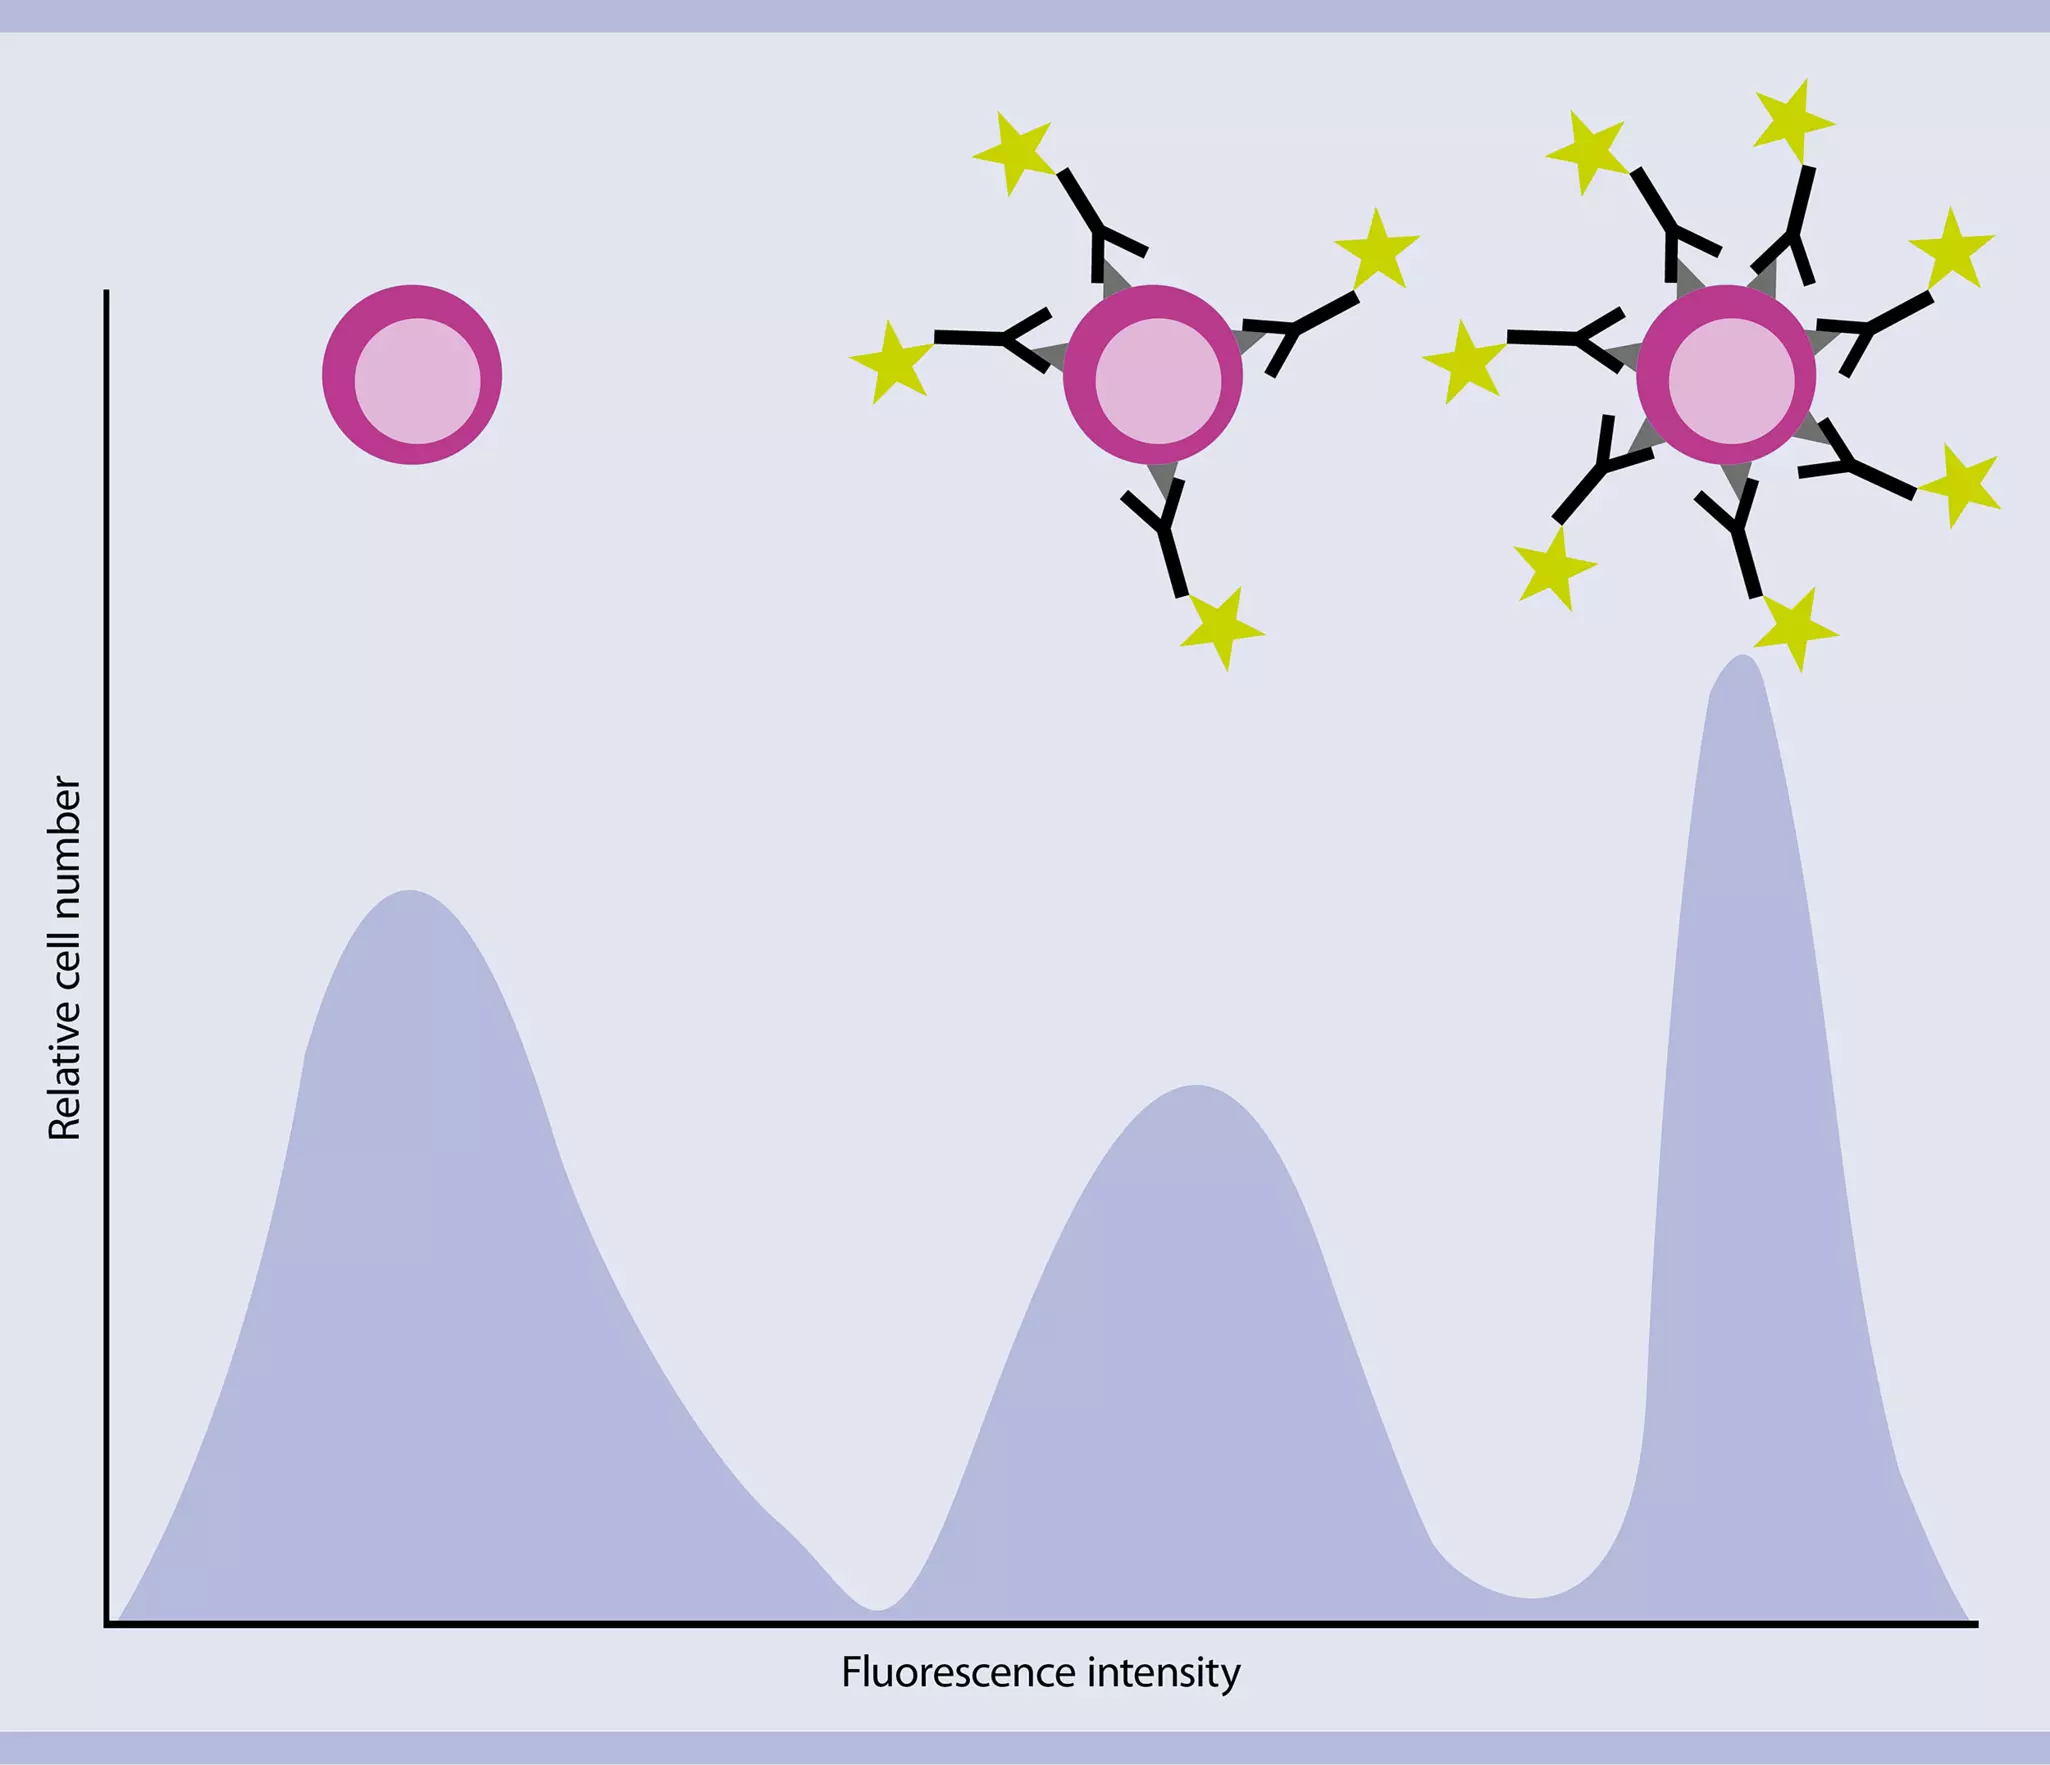
Univariate plots allow the visualization of one optical parameter (fluorescence or light scattering) versus event number. For each event, the signal intensity values of each measured parameter are stored in a data file. As events start to accumulate, a “curve” is generated that describes the distribution of the measured events according to their signal intensity.
3.1.2 Bivariate plots – dot plots
Dot plots allow the visualization of two optical parameters in one graph. The position of an event is determined by two values, i.e., the signal intensities for the optical parameters displayed on the x- and y-axis. When all events are plotted, events with similar intensity values accumulate in clusters, which can represent certain cell populations.

3.1.3 Bivariate plots – density plots
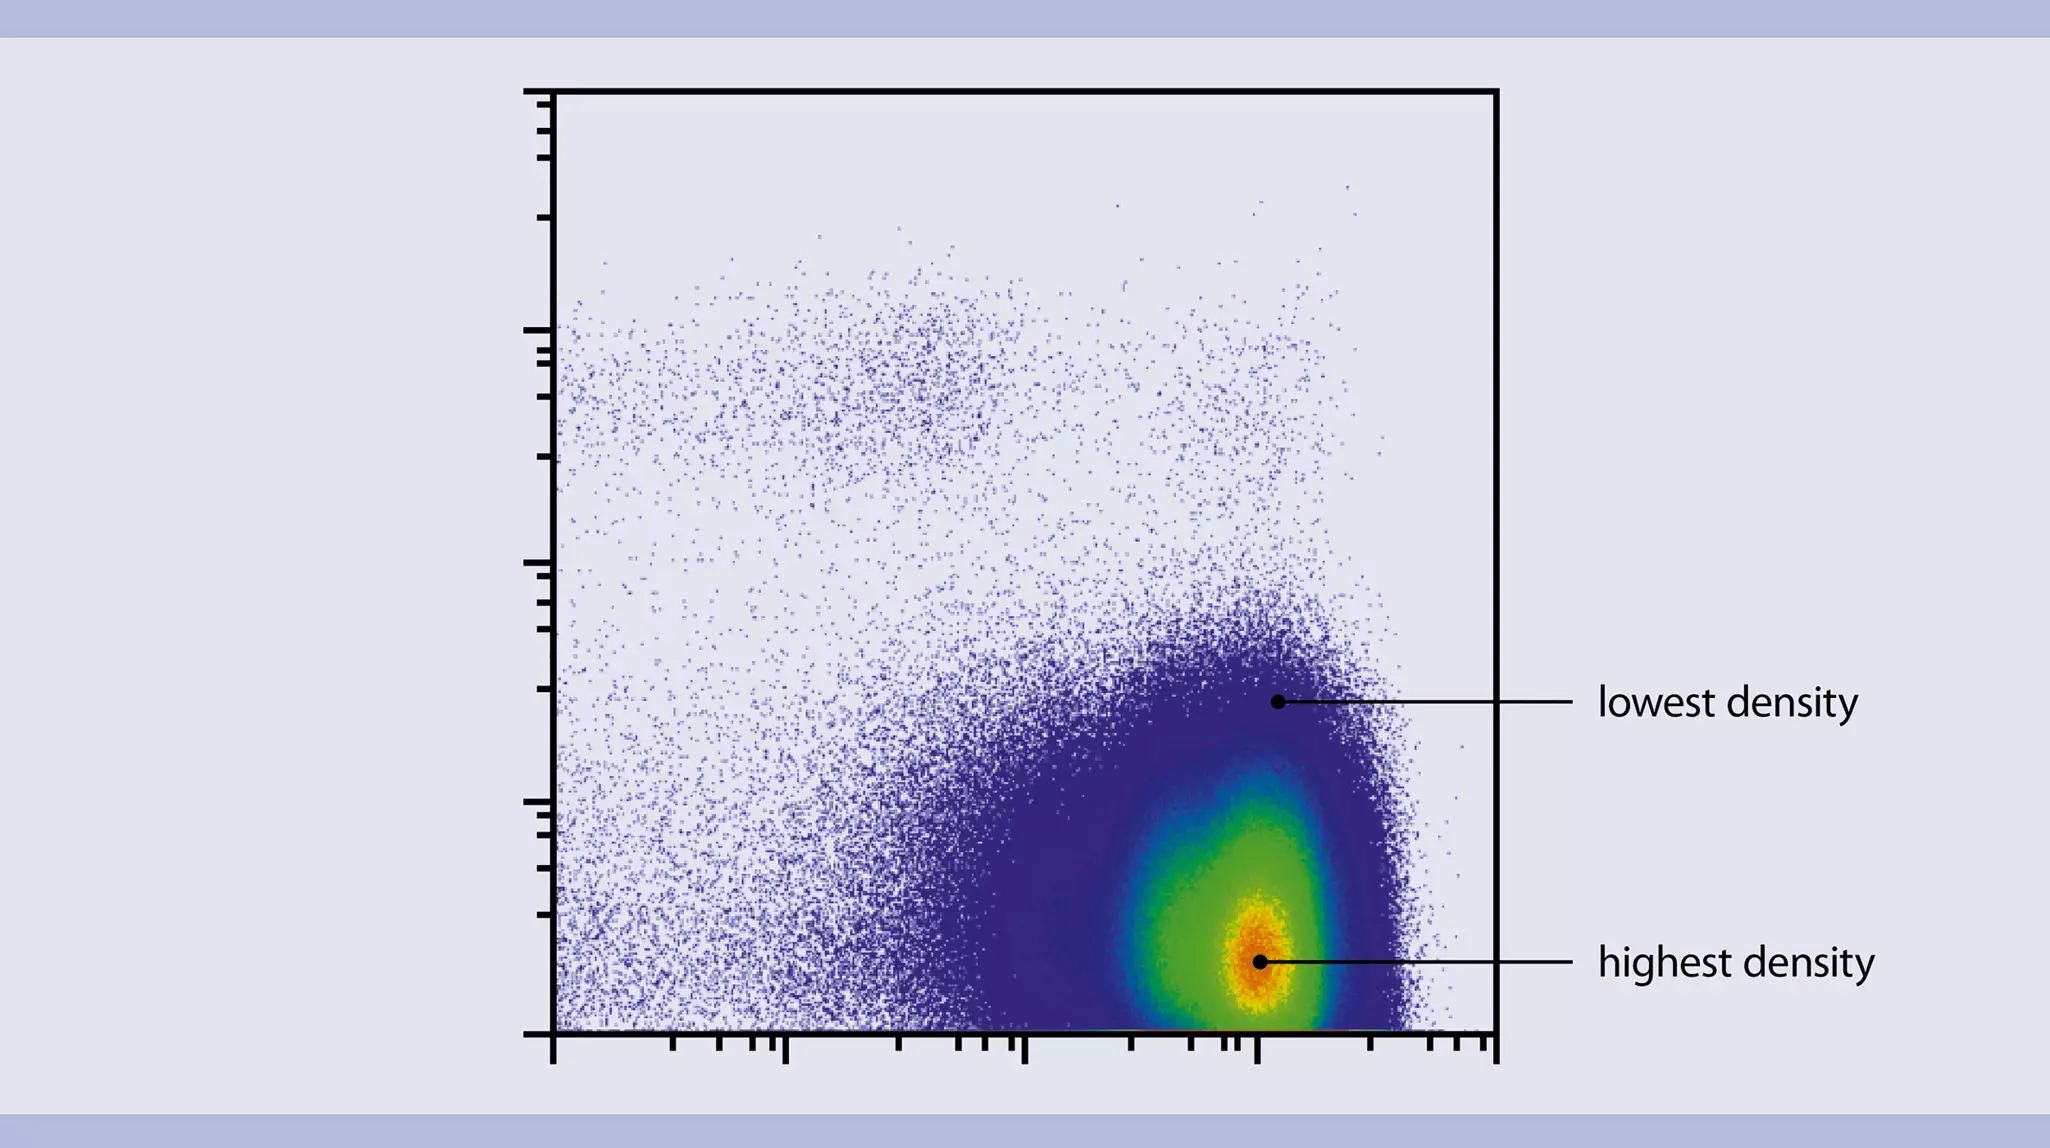
Density plots display two parameters as a frequency distribution similar to a dot plot (each cell is represented as a dot). Additionally, this type of plots depicts the distribution of cells within a population characterized by a very high density of events.