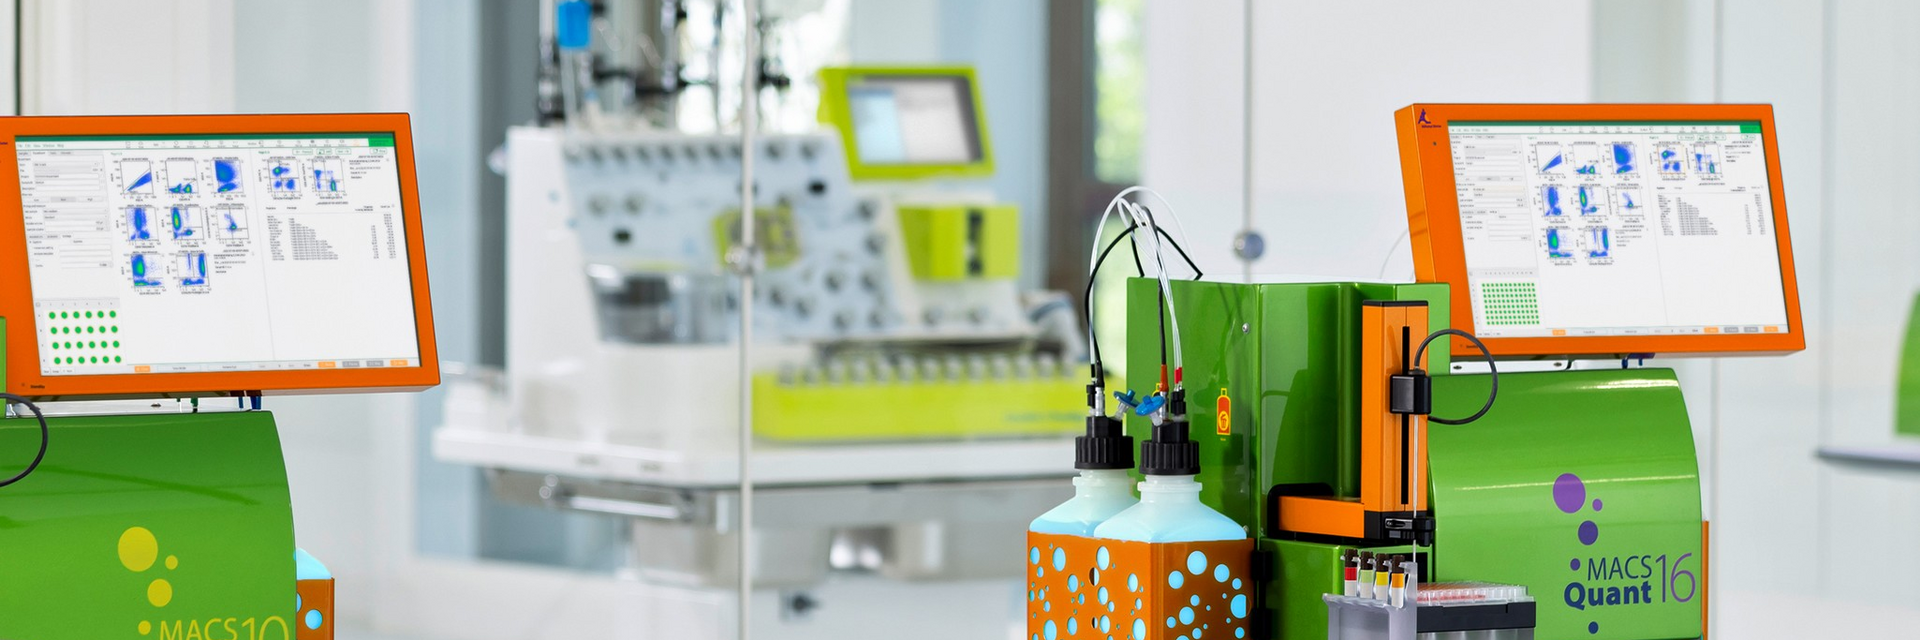
Two MACSQuant Analyzer flow cytometer in a clean room used for cell analysis during cell and gene therapy manufacturing on the CliniMACS Prodigy Platform in the background
Logo

Cell cycle analysis using multiparameter flow cytometry

The cell cycle is a tightly regulated multistage process involved in normal cell growth and division, organism development, and often a contributor to disease when dysregulated. As it controls cell proliferation and differentiation, accurate analysis of cell cycle can give important insights into the state of a cell at a given moment and understand mechanisms of disease.
Our innovative flow cytometry instruments and software, coupled with an extended selection of dyes and antibodies offer you a convenient solution for your cell cycle workflow. Check out our flexible dyes for DNA content analysis and our antibody options for proliferation studies and characterization of cell cycle phases.

The four cell cycle phases

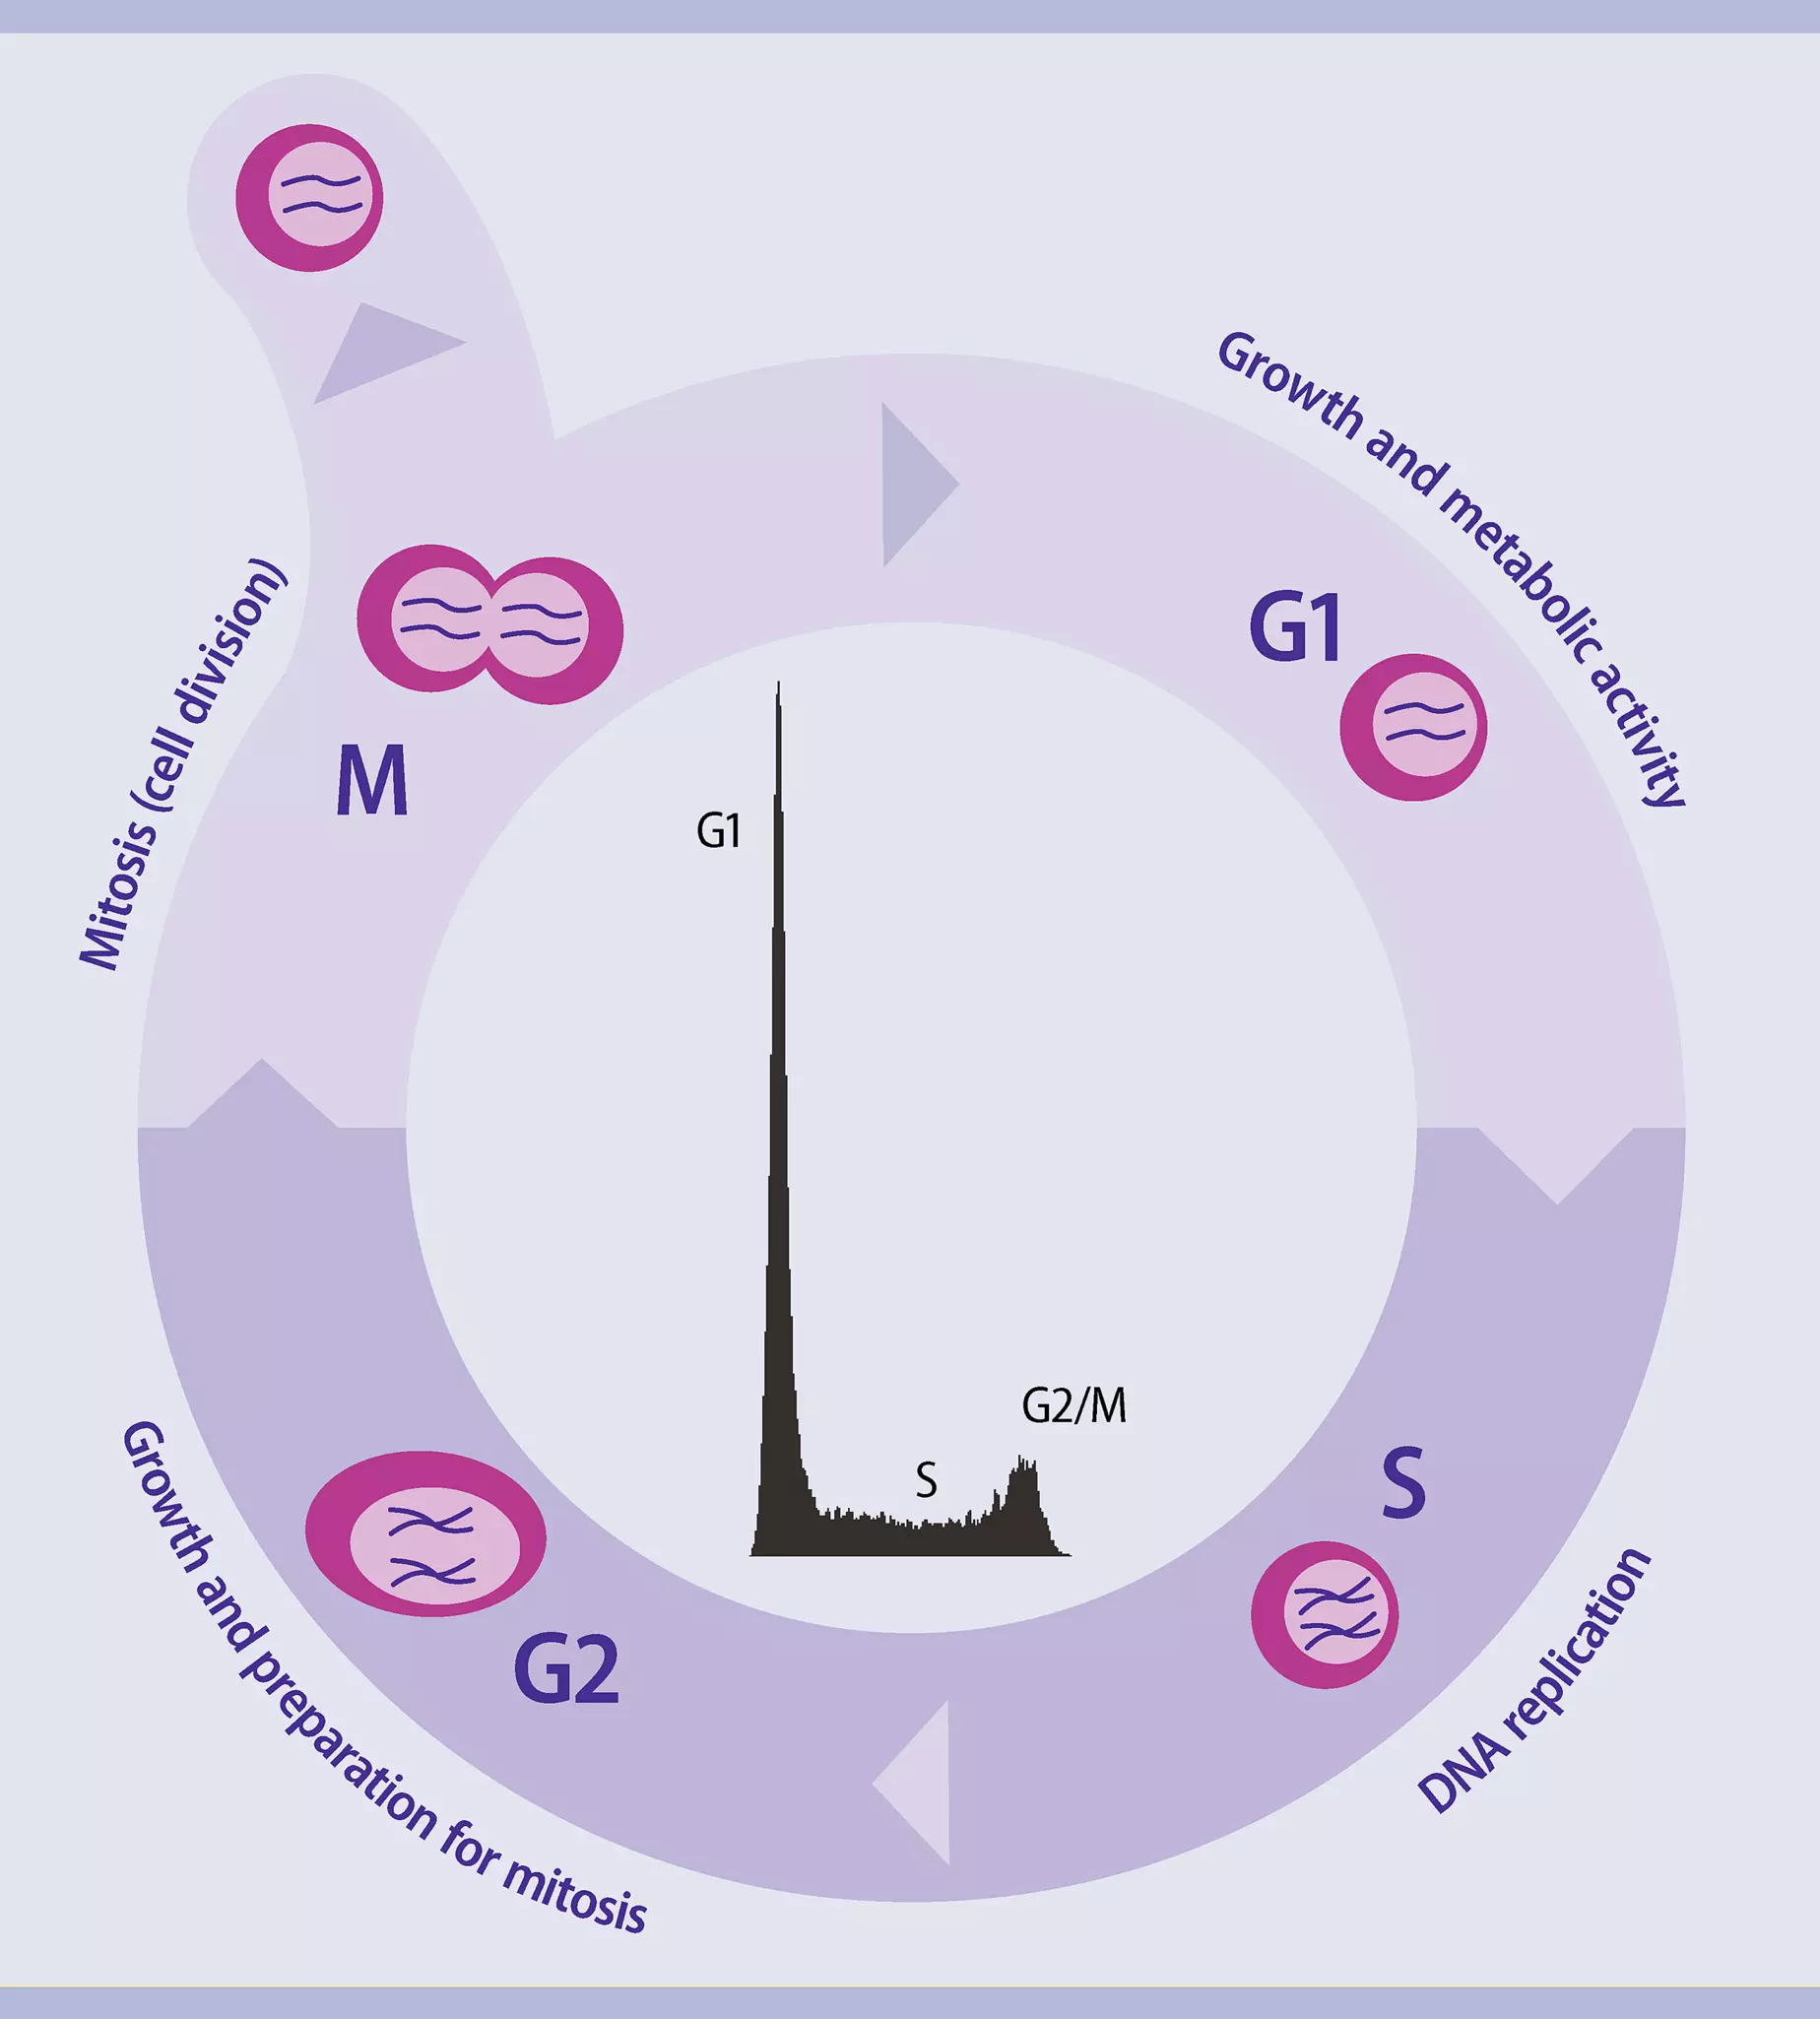
Infographic showing the 4 different phases of the cell cycle
All phases of the cell cycle

The cell cycle is a strictly regulated process that is responsible for appropriate cellular growth, development, and differentiation. It combines DNA replication with chromosomal segregation to ensure equal distribution of duplicated genetic material in the daughter cells.

Cell cycle phases are divided into four sequential stages that progress from quiescence (G0 phase) to proliferation (G1, S, G2, and M phases), and back to G0 phase. The deregulation of this process is considered a hallmark of tumor cell development.

Therefore, both academic and industrial drug discovery programs have strongly focused on the development of drugs targeting cell cycle phases. Using advanced flow cytometry researchers can rapidly and precisely determine different phases of the cell cycle.

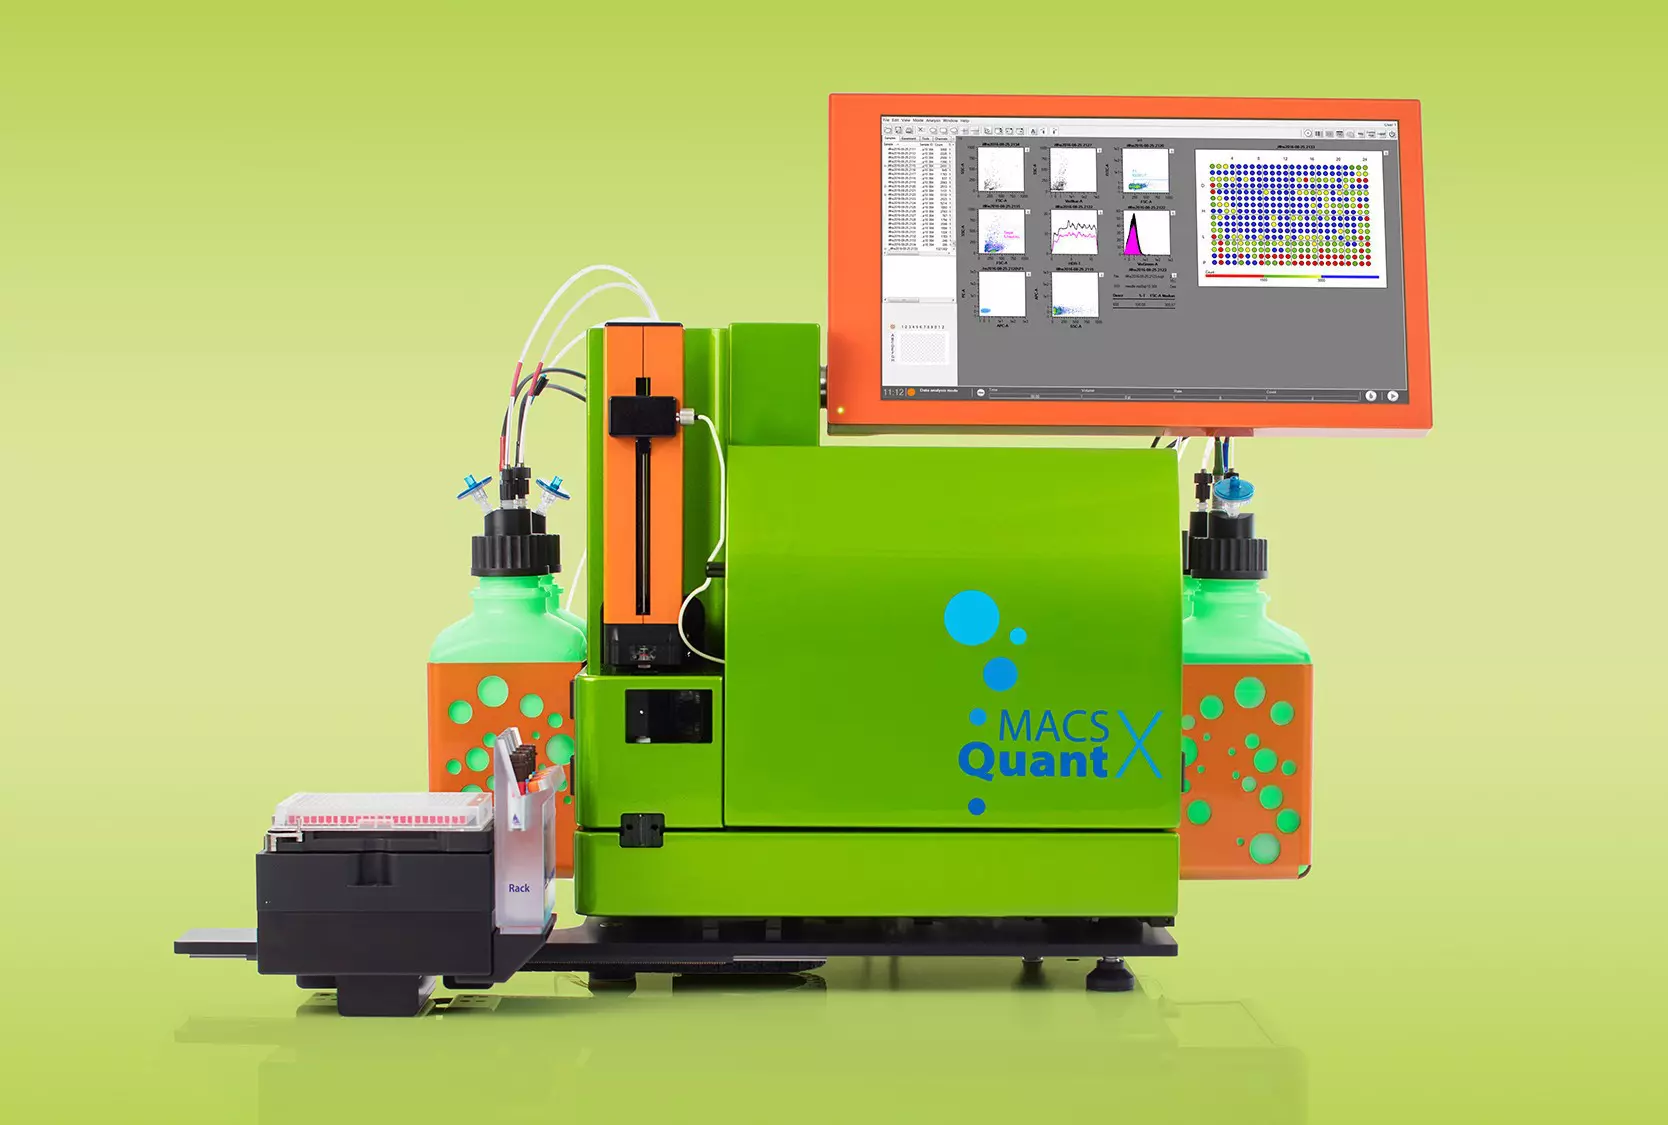
MACSQuant X, a compact, efficient flow cytometer, designed for high-throughput flows with automated multiparameter analysis of up to 384 wells
Cell cycle analysis using MACSQuant® Flow Cytometers

DNA content

Histogram showing cell cycle results from flow cytometry-based DNA content analysis
Cell cycle results from flow cytometry-based DNA content analysis displayed as a histogram

Traditionally, cell cycle phases are analyzed by evaluation of a DNA histogram generated by flow cytometry. This technique is fast and reproducible and can, for a well-defined cell population, give an approximation of the number of cells in G0/G1, S, and G2/M.
However, G0 and G2 cells cannot be separated from G1 and M cells, respectively. This limitation can partly be overcome by acridine orange staining giving discrimination of G0 from G1. Furthermore, histogram analysis of tumor samples with aneuploid populations can be difficult and sometimes impossible.

In a flow cytometer cell cycle analysis based on DNA content measurement is usually analyzed on a linear scale since the differences in fluorescence are usually small. Flow cytometry software programs offer algorithms to accurately estimate the cell cycle phases.

Proliferation-associated protein expression

Different proliferation- and cell cycle-related antigens have been described, allowing for the evaluation of cell kinetic parameters by detecting the expression of these antigens.

Histogram identifying cells in the S-phase of the cell cycle based on PCNA expression using a flow cytometry-based analysis
Cell cycle results from flow cytometry-based DNA content analysis displayed as a histogram

Identification of S-phase cells by detection of PCNA

Proliferating cell nuclear antigen (PCNA) cyclin is expressed mainly during S phase and acts as a scaffold to recruit proteins involved in DNA replication, DNA repair, chromatin remodeling, and epigenetics.

PCNA expression has been found to correlate with tumorigenesis, mainly with the degree of malignancy, vascular infiltration, distant metastasis, and survival. This antigen has been described as a biomarker of colorectal adenocarcinoma.

Flow cytometric analysis showing the identification of proliferating cells by detection of the Ki-67 marker
Identification of proliferating cells by detection of the Ki-67 marker

Identification of proliferating cells by detection of the Ki-67 marker

Highly induced during the cell cycle and absent in resting G0 cells, the nuclear protein Ki-67 is broadly recognized as a cell proliferation marker, with well-established clinical value in cancer diagnosis and prognosis.

Cell cycle-associated protein expression

Cyclins are a family of proteins that control the progression of cells through the cell cycle by activating cyclin-dependent kinase (CDK) enzymes. The most important cyclins involved in cell cycle processes are listed below.

ProteinFunctionInhibitory protein
Cyclin AControl of S phase in complex with Cdk1 or Cdk2Cdk1 or Cdk2
Cyclin BControl of G2/M phase in complex with Cdk1Cdk1
Cyclin DControl of G1 phase in complex with Cdk4 or Cdk6; Regulation of Rb/E2F transcriptionCdk4 or Cdk6
Cyclin EControl of G1-S phase in complex with Cdk2; Regulation of Rb/E2F transcriptionCdk2
Cyclin HCdk-activating kinase and RNAPII transcription in complex with Cdk7Cdk7

Table Legend

Phosphorylated Histone H3

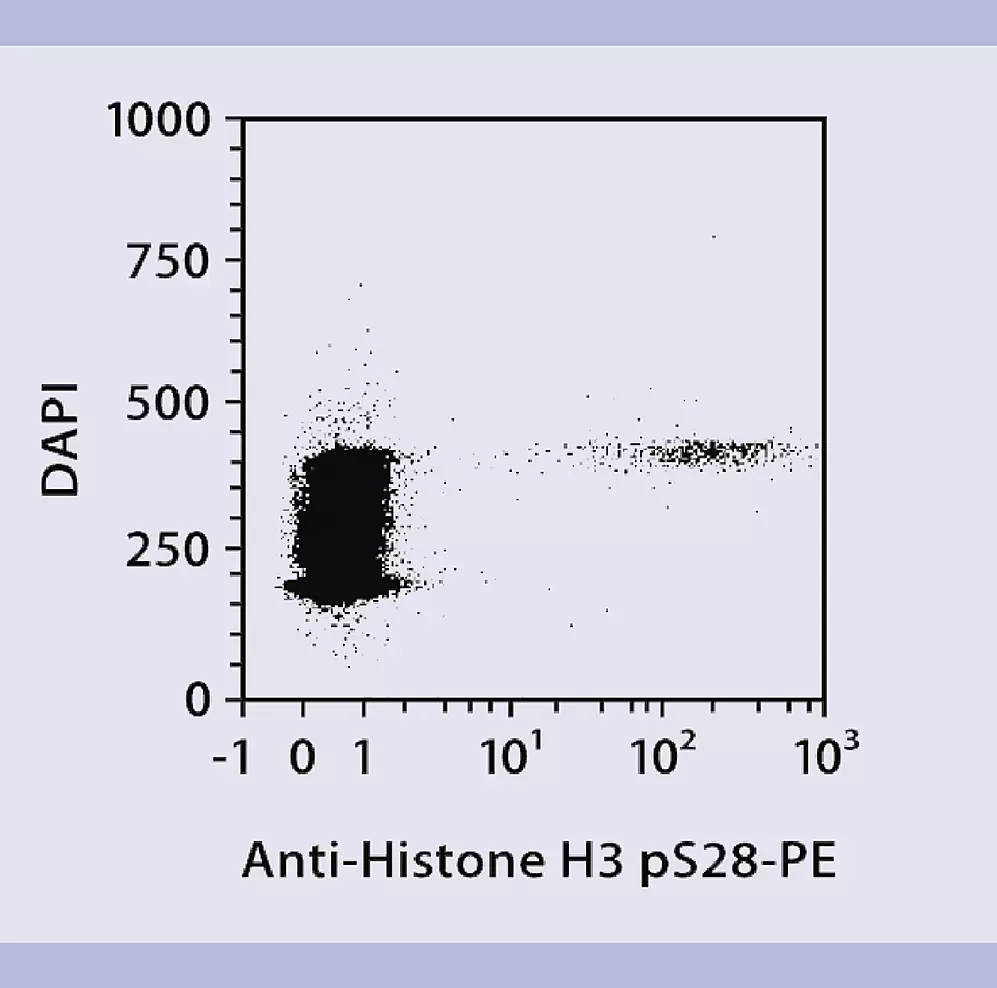
Flow cytometric analysis showing the identification of M phase cells using phosphorylated histone H3 as a marker
Identification of M phase cells by detection of phosphorylated histone H3

Histone H3 becomes phosphorylated only during M phase of the cell cycle.

Thus, histone H3 pSer28 can be used as a specific marker for M-phase cells and combined with other proliferation tools to further segment cell cycle compartments.

You have previously chosen International as your location.
What do you want to do?