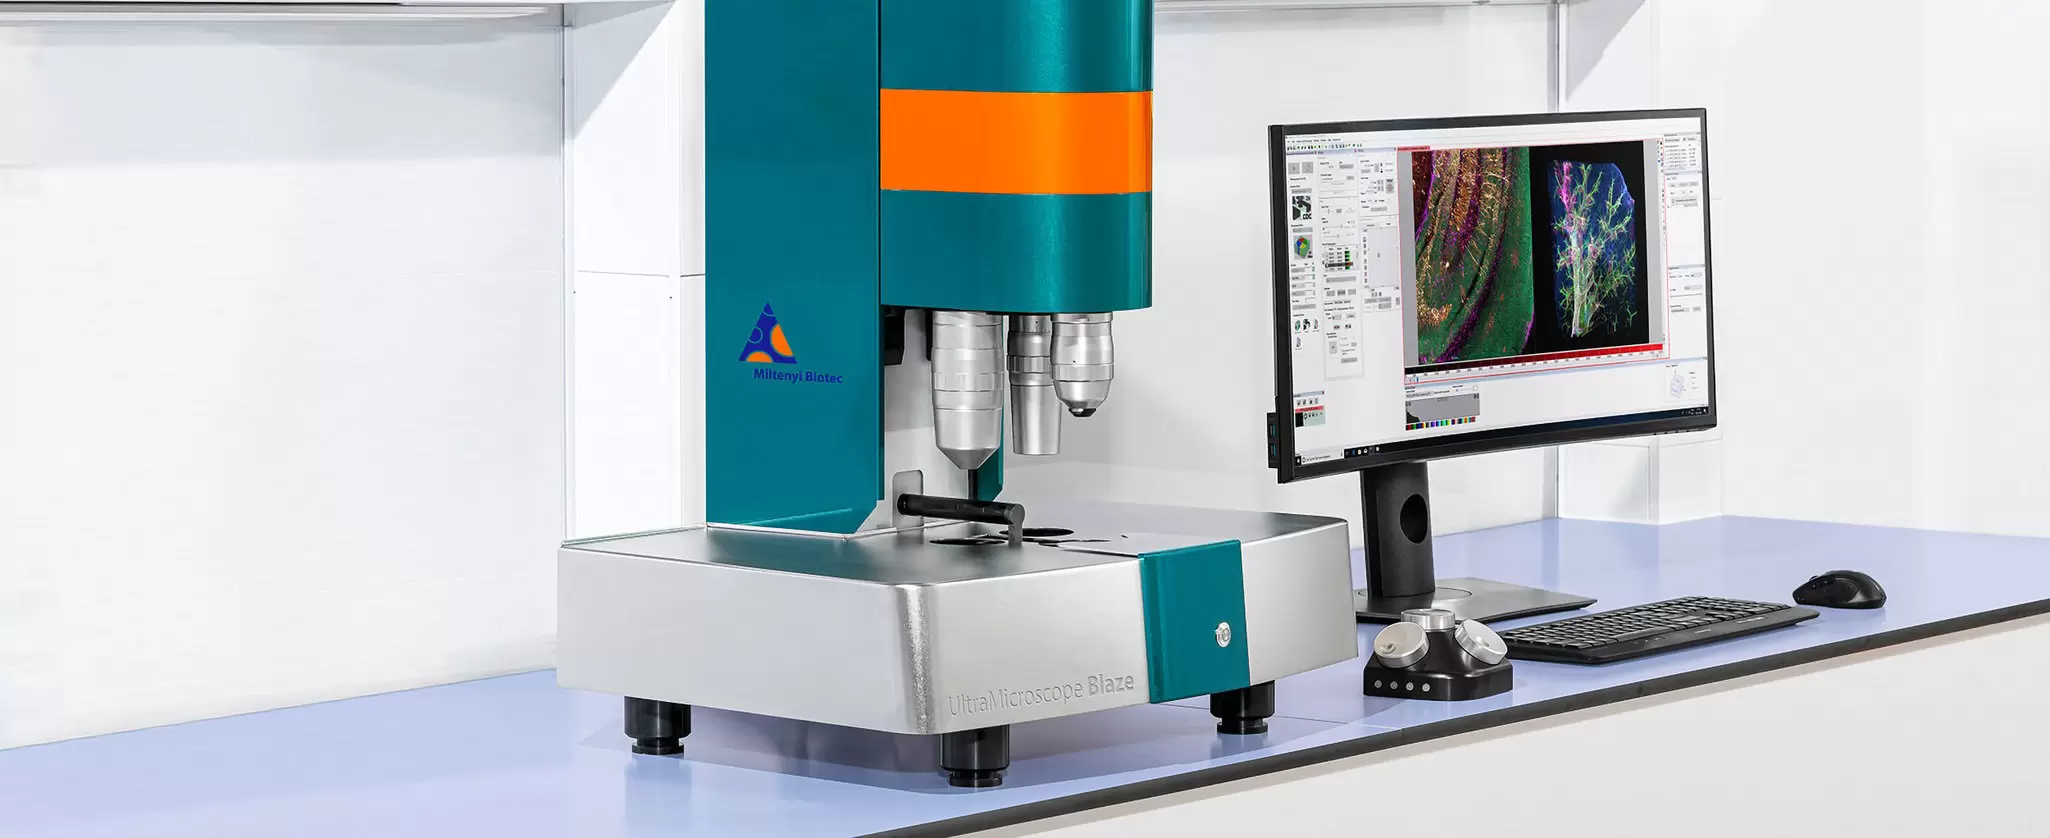
Light sheet microscope UltraMicroscope Blaze for fully automated 3D imaging of multiple samples

UltraMicroscope Blaze™ Analysis Tool

Bridging the Allen Brain Atlas and mouse data with the UltraMicroscope Blaze

Content

  • Introduction
  • Open-source registration and annotation software
  • Registration and annotation: concepts and pipeline
  • Common registration pitfalls
  • Hyperparameter tuning to improve robustness to orientation
  • Result: ROI-resolved datasets
  • Discussion and future directions
  • References

Introduction

The UltraMicroscope Blaze enables rapid acquisition of high resolution, three dimensional datasets from intact, cleared tissues at cellular resolution, supporting comprehensive whole brain imaging in the mouse. Light sheet fluorescence microscopy (LSFM) is an established imaging modality in neuroscience.1-2 The speed and easy-to-use functionality of the UltraMicroscope Blaze facilitate efficient data generation for a variety of research applications, including studies of neurodegenerative disease, therapeutic development, and fundamental brain organization.

To enable a quantitative and reproducible analysis of mouse brain datasets, volumetric images must be annotated within a standardized anatomical reference framework. The Allen Mouse Brain Common Coordinate Framework (CCFv3) is a three dimensional reference atlas constructed from serial two photon tomography images of 1,675 individual brains and annotated with a hierarchical set of anatomical regions.3

Since its introduction, CCFv3, commonly referred to as the Allen Brain Atlas (ABA), has become the standard for atlas based integration and comparison of mouse brain data. However, registering LSFM datasets to this atlas remains challenging due to differences in imaging modalities, variability in image quality, and the complexity of available registration workflows.

This application note describes a practical approach for registering UltraMicroscope Blaze LSFM datasets to the ABA using open source software, with a focus on ClearMap 2. Key principles of atlas registration are introduced, common challenges are discussed, and parameter optimization strategies are demonstrated to achieve robust performance across different imaging orientations. Atlas based annotation enables region specific voxel and cell level quantification, giving UltraMicroscope Blaze users the ability to generate standardized, quantitative insights from whole brain imaging data.

Open-source registration and annotation software

Researchers interested in ABA registration face a wide range of available software tools, each with distinct challenges. Here, we focus on Python based solutions and restrict our scope to fully three dimensional registration methods that could process light sheet fluorescence microscopy data. Table 1 summarizes several commonly used tools. Note that three of the tools (ClearMap, FriendlyClearMap, and Khoury) rely on the same underlying registration engine (Elastix), and therefore their registration performance may be similar, despite their different high-level features.4-5

LibraryReferenceCitationsDetails
ClearMap 2(Renier et al. 2016; Kirst et al. 2020)964; 421Gold standard for Blaze/ABA registration; includes nuclear and vascular segmentation; used in this publication
ANTsX/ANTsPy(Tustison et al. 2021)391Comprehensive toolkit for imaging data; lacks Blaze-specific tuning
Brainreg(Tyson et al. 2022)77Designed for serial two-photon images and electrode segmentation; integrated with more up-to-date python libraries
Khoury(Khoury et al. 2025)40Recent Blaze registration example with a convenient abridged annotation set

Table 1. Summary of selected ABA Registration Python Libraries (citation counts from March 2026).

Tool Designed for LSFM3D Volumetric
Registration
Integrated
Segmentation
Installation ComplexityAdoption / Maturity
ClearMap 2YesYesNuclear, vascularHighWidely used, highly cited
FriendlyClearMapYesYesNuclear, vascularLow–Medium (docker-based)Emerging
ANTsXNoYesNoMedium–HighWidely used (general purpose)
BrainregNoYesNoMediumModerate
KhouryYesYesLimitedMediumEarly adoption

Table 2. Comparison of commonly used software tools for ABA registration of LSFM datasets

While the tools listed here are the current cutting-edge technology, fragmented software ecosystems and technical complexity remain as barriers for many researchers. These challenges are addressed in this technical note. In parallel, Miltenyi Biotec is developing a streamlined, validated, code free registration and annotation solution designed to work directly with UltraMicroscope Blaze datasets.

Registration and annotation: concepts and pipeline

This section introduces the key concepts of three dimensional atlas registration and annotation, illustrated in figures 1 and 2.

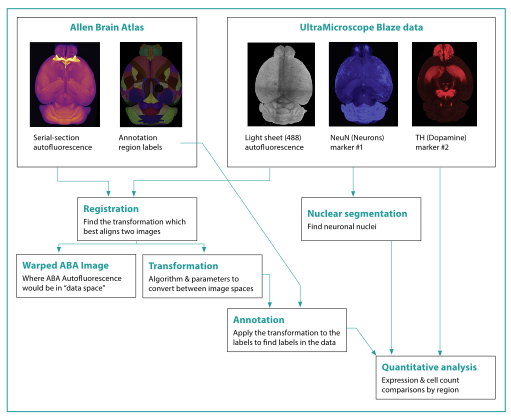
As shown in the top left panel (fig. 1), the Allen Mouse Brain CCFv3 provides a 3D autofluorescence reference image and associated anatomical region labels, while the UltraMicroscope Blaze datasets include up to five co-registered imaging channels within a shared coordinate space. Atlas registration aligns the atlas autofluorescence image to the UltraMicroscope Blaze autofluorescence image, generating a transformation that transfers region labels into the instrument’s data.

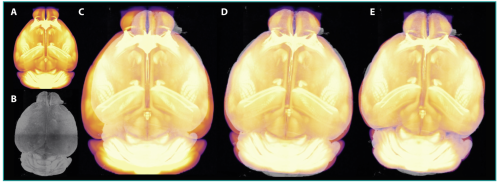
These voxel annotations enable region based signal analysis, cell or vessel quantification, and direct comparisons across datasets and conditions. ClearMap performs registration in the two steps depicted in figure 2: affine and b-spline registration. Affine registration applies global transformations (translation, rotation, scaling, and shearing) to align overall brain position and size (fig. 2d). This is followed by b-spline registration, which applies flexible, local adjustments to align finer anatomical details and account for individual variation and tissue clearing effects (fig. 2e).

During each registration step, the algorithms search the space of possible transformations to identify “parameters” (mathematical values defining the transformation, such as how far to shift the center in the x direction). They select parameters to maximize mutual information between the moving and fixed images. “hyperparameters” are user-defined values which set up the quantitative structure and define how registration should be performed. Hyperparameter tuning is described in later sections.

Figure 1. General workflow overview. Input data include the ABA and UltraMicroscope Blaze LSFM datasets. Registration was performed using autofluorescence (488 nm) together with NeuN (blue) and tyrosine hydroxylase (TH; red). The UltraMicroscope Blaze supports up to five imaging channels per sample; the arrows indicate subsequent quantitative workflows and derived data objects.
Play video

Autofluorescence image workflow.

Autofluorescence image workflow.
Figure 2. Autofluorescence image registration workflow. Detailed transformation intermediates of autofluorescence images. (a) The initial ABA autofluorescence image, with bright white matter and fiber tracts, can be transformed to fit the data space from. (b) UltraMicroscope Blaze autofluorescence image. (c) Prior to registration, the images are in the same orientation but do not align well. (d) After affine registration, the ABA image has been moved, rotated, scaled, and sheared to match the data, but details remain misaligned, as can be seen in the lower corners. (e) After b-spline registration, the local anatomical features, such as ventricle boundaries, cortical folds, and edges are aligned. A video of this is available.

Common registration pitfalls

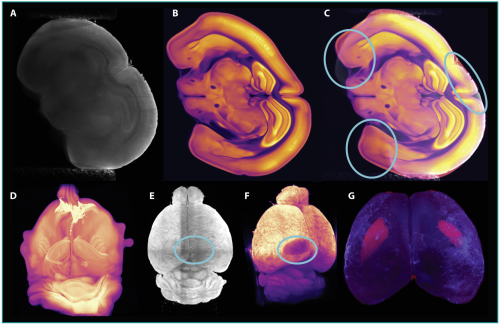
Registration is susceptible to several common pitfalls and should always be validated, at minimum, by visual inspection (fig. 3).

Incorrect sample orientation can lead to global misalignment if the affine registration does not rotate far enough, while overly permissive b-spline settings may cause unrealistic local warping by overfitting noise or artifacts.

Registration algorithms may also incorrectly align imaging artifacts rather than true anatomy, producing anatomically incorrect results that nevertheless score well numerically. More subtle errors may not be apparent from autofluorescence images alone.

Inspecting additional markers provides an effective validation strategy by confirming that known expression patterns align with annotated regions.

Figure 3. Examples of registration errors. (a–c) Datasets with residual sample twist can lead to failed affine registration: (a) UltraMicroscope Blaze autofluorescence, (b) misaligned ABA autofluorescence, and (c) overlay showing ventral cortical misalignment. (d) Excessively flexible b-spline registration can overfit artifacts, producing unrealistic warping. (e–f) Registration may incorrectly align imaging artifacts between two UltraMicroscope Blaze datasets, resulting in global misalignment. (g) Subtle boundary errors can be detected using marker expression. Here, TH positive tissue (red) from the caudoputamen is incorrectly included in a cortical annotation.

Hyperparameter tuning to improve robustness to orientation

So far, we have focused on qualitative methods for assessing registration quality. Next, we describe a quantitative experiment designed to test the robustness of the registration pipeline by evaluating whether the same brain imaged at different orientations can be consistently annotated using ClearMap. By defining a consistency metric, we assess how hyperparameter choices influence performance and identify settings that remain robust across orientations.

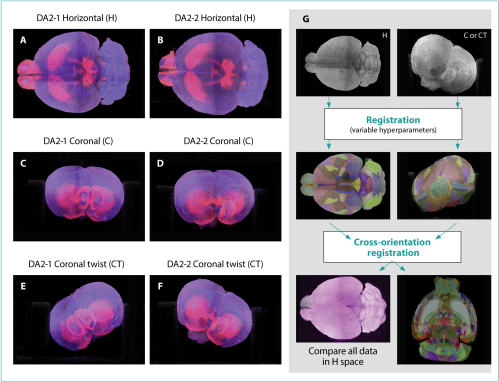
As shown in figure 4a–f, two adult mouse brains were stained for NeuN and TH, cleared, and imaged in three orientations: horizontal (H), coronal (C), and coronal twist (CT). Horizontal and coronal orientations are commonly used on the UltraMicroscope Blaze to optimize the illumination of specific regions, while the twisted orientation reflects a frequent positioning challenge encountered in practice.

Figure 4. Overview of datasets and registration optimization. (a–f) UltraMicroscope Blaze datasets of adult mouse brains imaged in different orientations (NeuN, blue; TH, red; autofluorescence, gray). Columns show samples and rows show orientations. (g) Schematic of the optimization experiment, in which datasets were registered using different hyperparameter sets and compared by transforming annotations into a common coordinate space.

The quantitative experiment is summarized in figure 4g. All datasets were preprocessed and roughly aligned to the atlas orientation before running the registration and annotation pipeline with different hyperparameter sets. To compare results across orientations, annotations from coronal (C) and coronal twist (CT) datasets were mapped into the horizontal (H) data space using additional cross orientation registrations. Agreement between annotations was then quantified using the volume weighted mean Dice score (wDice), which ranges from zero (no overlap) to one (perfect overlap).

Using this metric, the default ClearMap hyperparameters performed well for H and C datasets (wDice ~0.7), indicating consistent regional annotation. However, larger sample twists, imaging artifacts, or fine boundary requirements, such as those seen in CT datasets, revealed limitations of the default settings and motivated further optimization.

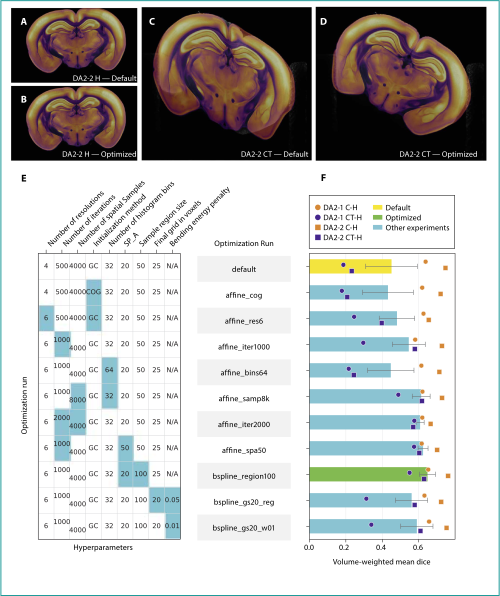
To address this, selected affine and b-spline hyperparameters (table 3) were systematically adjusted, focusing on enabling larger rotations and improved local alignment. Parameter changes were retained only when they improved performance without significantly increasing runtime. Figure 5e-f visualize the tested parameter combinations and their performance, showing that registration quality for C→H comparisons remained stable while improvements were primarily observed for CT data.

Figure 5. Hyperparameter tuning results. (a–d) Example coronal sections showing UltraMicroscope Blaze autofluorescence (gray) and warped ABA autofluorescence (inferno). Image labels indicate the sample, orientation, and parameter set, with misalignment in panel (c). (e) Summary of tested hyperparameters; light blue cells mark changes from the previous setting (columns as in Table 2). (f) Performance of each parameter set, measured by wDice score (higher is better). Performance improves during the greedy search, with the bspline_region100 sweep (green) achieving the best results and selected as the final parameter set.

For CT→H alignment, two affine changes improved performance: adding more resolution levels and increasing the number of iterations per level. The extra low resolution steps helped achieve large rotations, and doubling the iterations (500 to 1,000) produced the most significant improvement in wDice score. Although 2,000 iterations improved accuracy slightly, this modification was excluded due to long runtimes. Other affine settings showed no meaningful benefit and were left at default values. For b-spline registration, increasing the sample region size from 50 to 100 µm led to effective improvement, allowing larger local deformations. Increasing the number of control points with added deformation penalties did not improve results, despite being a theoretically useful strategy for fine-tuning.

Overall, three small changes (more affine resolutions, more affine iterations, and larger b-spline sample regions), corrected the CT registration failures (fig. 5d). Users experiencing similar issues with ClearMap can adjust these parameters or run a similar tuning experiment.

Hyperparameter DescriptionTrade-offDefault valueOptimized value
Number of resolutions (A)More pyramid levels enable coarse-to-fine
alignment of large misalignments.
Runtime increases with more levels.4
6
Maximum number of iterations (A)Maximum iterations per pyramid level;
more iterations enable deeper search.
Runtime increases proportionally.5001000
Number of spatial
samples (A)
Voxel samples for alignment; more samples
stabilize gradients.
Runtime increases proportionally.40004000
Automatic transform
initialization method (A)
Method for aligning image centers before
optimization.
None.Geometrical
center
Geometrical
center
Number of histogram
bins (A)
Intensity bins for alignment; more bins add detail.Higher values cause noisier gradients.3232
SP_A (A)Controls step-size decay; larger values keep steps larger longer.Runtime increases with region volume.2020
Sample region size (B)Sub-volume size for gradient sampling;
larger sizes add spatial context.
Runtime increases with region volume.50 50 50100 100 100
Final grid spacing in voxels (B)Spacing of B-spline control points; smaller
values allow finer local deformation.
If too small, increases distortion risk; pair with bending energy penalty.25 25 2525 25 25
     

Table 3. Hyperparameters tested during the optimization experiment. Hyperparameters are grouped by affine (A) and b-spline (B) steps. Three highlighted entries indicate changes from the default settings in the optimized hyperparameter set.

Result: ROI-resolved datasets

Robust annotations enable the quantification of UltraMicroscope Blaze marker expression within ABA defined anatomical regions for biological analysis.

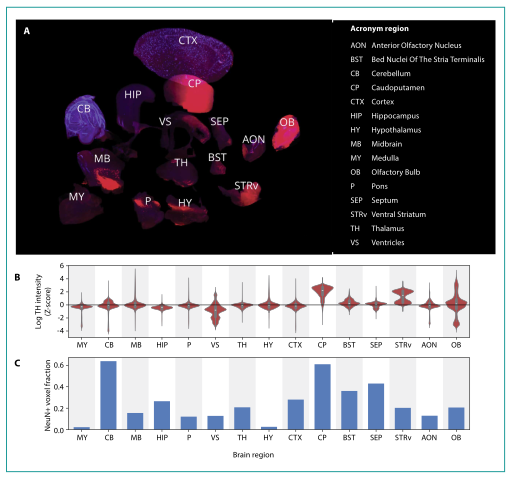
Figure 6 summarizes NeuN and TH expression across 15 ABA defined brain regions. A virtual dissection (fig. 6a) separates regions to visualize boundaries and confirm improved annotations, resolving earlier cortex boundary errors. Marker expression is quantified and shown for one representative sample due to high consistency across datasets (fig. 6b–c). The TH expression is measured using voxel intensity distributions, since expression level varies from cell to cell, while NeuN expression is estimated using the fraction of NeuN+ voxels as a proxy for neuronal density.

Overall, marker distributions largely match published patterns10-11. For TH, high expression is observed in the caudoputamen and selected striatal, olfactory, and midbrain regions, while NeuN density is highest in the cerebellum and moderate across most brain regions. Deviations in deeper regions likely reflect reduced antibody penetration or tissue clearing. Despite these limitations, the results demonstrate the value of ABA registration for extracting biologically meaningful, brain wide expression patterns.

Figure 6. Marker expression in ABA brain regions. Data shown are from DA2 2_H and are representative of all samples. (a) Visualization of 15 brain regions (red: TH; blue: NeuN), which have been separated in space to reveal internal expression differences. (b) TH expression by region (log transformed, Z scored). (c) NeuN expression by region, shown as the fraction of NeuN+ voxels.
Play video

Marker expression in ABA brain regions

Marker expression in ABA brain regions

Discussion and future directions

This application note demonstrates a practical and reproducible workflow for registering UltraMicroscope Blaze light sheet data to the ABA, enabling atlas based, region resolved quantification of whole brain datasets. By identifying common registration challenges and showing that a small number of targeted parameter adjustments markedly improve robustness across imaging orientations, it provides UltraMicroscope Blaze users a reliable path from image acquisition to biologically relevant quantification. As atlas registration and analysis tools continue to advance, their integration with UltraMicroscope Blaze imaging will further simplify whole brain studies and support scalable, reproducible neuroscience research.

References

You have previously chosen International as your location.
What do you want to do?