6 tips for mastering flow cytometry panel design

Colorful antibody vials are sorted in rows according to color.
Logo

6 tips for mastering flow cytometry panel design

Key takeaways

  • Start with your biological question, not your fluorophores.
  • Design a comprehensive gating strategy that excludes unwanted cell populations.
  • Assign bright dyes to dim markers and dim dyes to highly expressed markers.
  • Reduce spectral overlap and compensate using proper controls.
  • Optimize panel performance through antibody and voltage titration.
  • Validate results with FMO, isotype, viability, and Fc-blocking controls when appropriate.

Whether you're working with a simple 4-color setup or a complex 24-color panel, successful flow cytometry panel design requires more than selecting the right antibodies. Marker selection, fluorophore assignment, panel optimization, and appropriate controls all influence data quality and interpretation. This guide walks you through the key steps for designing a robust flow cytometry panel that delivers reliable, reproducible results.

Total read: 5-10 minutes

Video summary

5 tips for flow cytometry panel building

Want your flow cytometry panels to work for you instead of against you?
In this short video, we share five easy tips, from gating tricks to fluorochrome and control picks. Watch the highlights, then head to the blog for the full rundown!

Follow our tips and become an expert in flow cytometry panel design

Content overview

Content

  • Tip 1: Define clear experimental goals for your flow cytometry panel
  • Tip 2: Exclude unwanted populations
  • Tip 3: Choose fluorophores based on instrument configuration
  • Tip 4: Check for spectral overlap and compensation needs
  • Tip 5: Optimize your signal resolution by titration
  • Tip 6: Select suitable controls for your flow cytometry panel
  • Resources

Tip 1: Define clear experimental goals for your flow cytometry panel

Start with a clear understanding of what you want to achieve with your flow cytometry panel. Identify:

  • Cell populations you need to distinguish (e.g., activated and exhausted T cells).
  • The relative frequency of your target cell populations in the material to be measured (e.g., low- or high-abundant subpopulations).
  • Critical markers for your readout (e.g., activation markers like CD69, exhaustion markers like PD-1).
  • Lineage markers to define major subsets (e.g., CD3, CD4, CD8 for T cells).

Once your priorities are set, it's easier to select the right markers and assign them to appropriate fluorophores.

Not sure how to choose the right markers? Jump to Tip 3 for help making your decision.

Read more about the expression of your antigen of interest:
The Human Cell Differentiation Molecule (HCDM) council frequently publishes new articles on the quantitative expression of CD markers. Their 2019 publication includes an interactive tool for easy analysis. Similarly, The Human Protein Atlas, UniProt, and the Expression Atlas share information on the expression of antigen markers in healthy and diseased tissue and cell lines.

Top view on antibody vials with color-coded lids placed in rows

Need help deciding which markers you need?

Miltenyi Biotec's flow cytometry panel builder has built-in options to suggest markers for specific cell types, as well as provide optimal panel-fluorophore composition recommendations.

Tip 2: Exclude unwanted populations

In this figure, the two dot plots are shown displaying the differentiation between live and dead staining using either viability dye (A) or 7-AAD (B).
Viability assessment by flow cytometry

Efficient gating means eliminating what you don't want:

  • Use dump channels, also known as exclusion channels, to stain and gate out unwanted cells. This includes populations that you don't want to analyze or that interfere with your readout. You can combine multiple antibodies that target unwanted cells while only using one fluorophore or a whole fluorescent channel. Choose dim to medium-brightness fluorophores that are still bright enough to clearly distinguish positive from negative cells.
  • Always include a viability stain to remove dead cells from your analysis. Choose the right dye depending on whether your cells will be fixed and combine it with your dump channel, if applicable.

Tip 3: Choose fluorophores based on instrument configuration

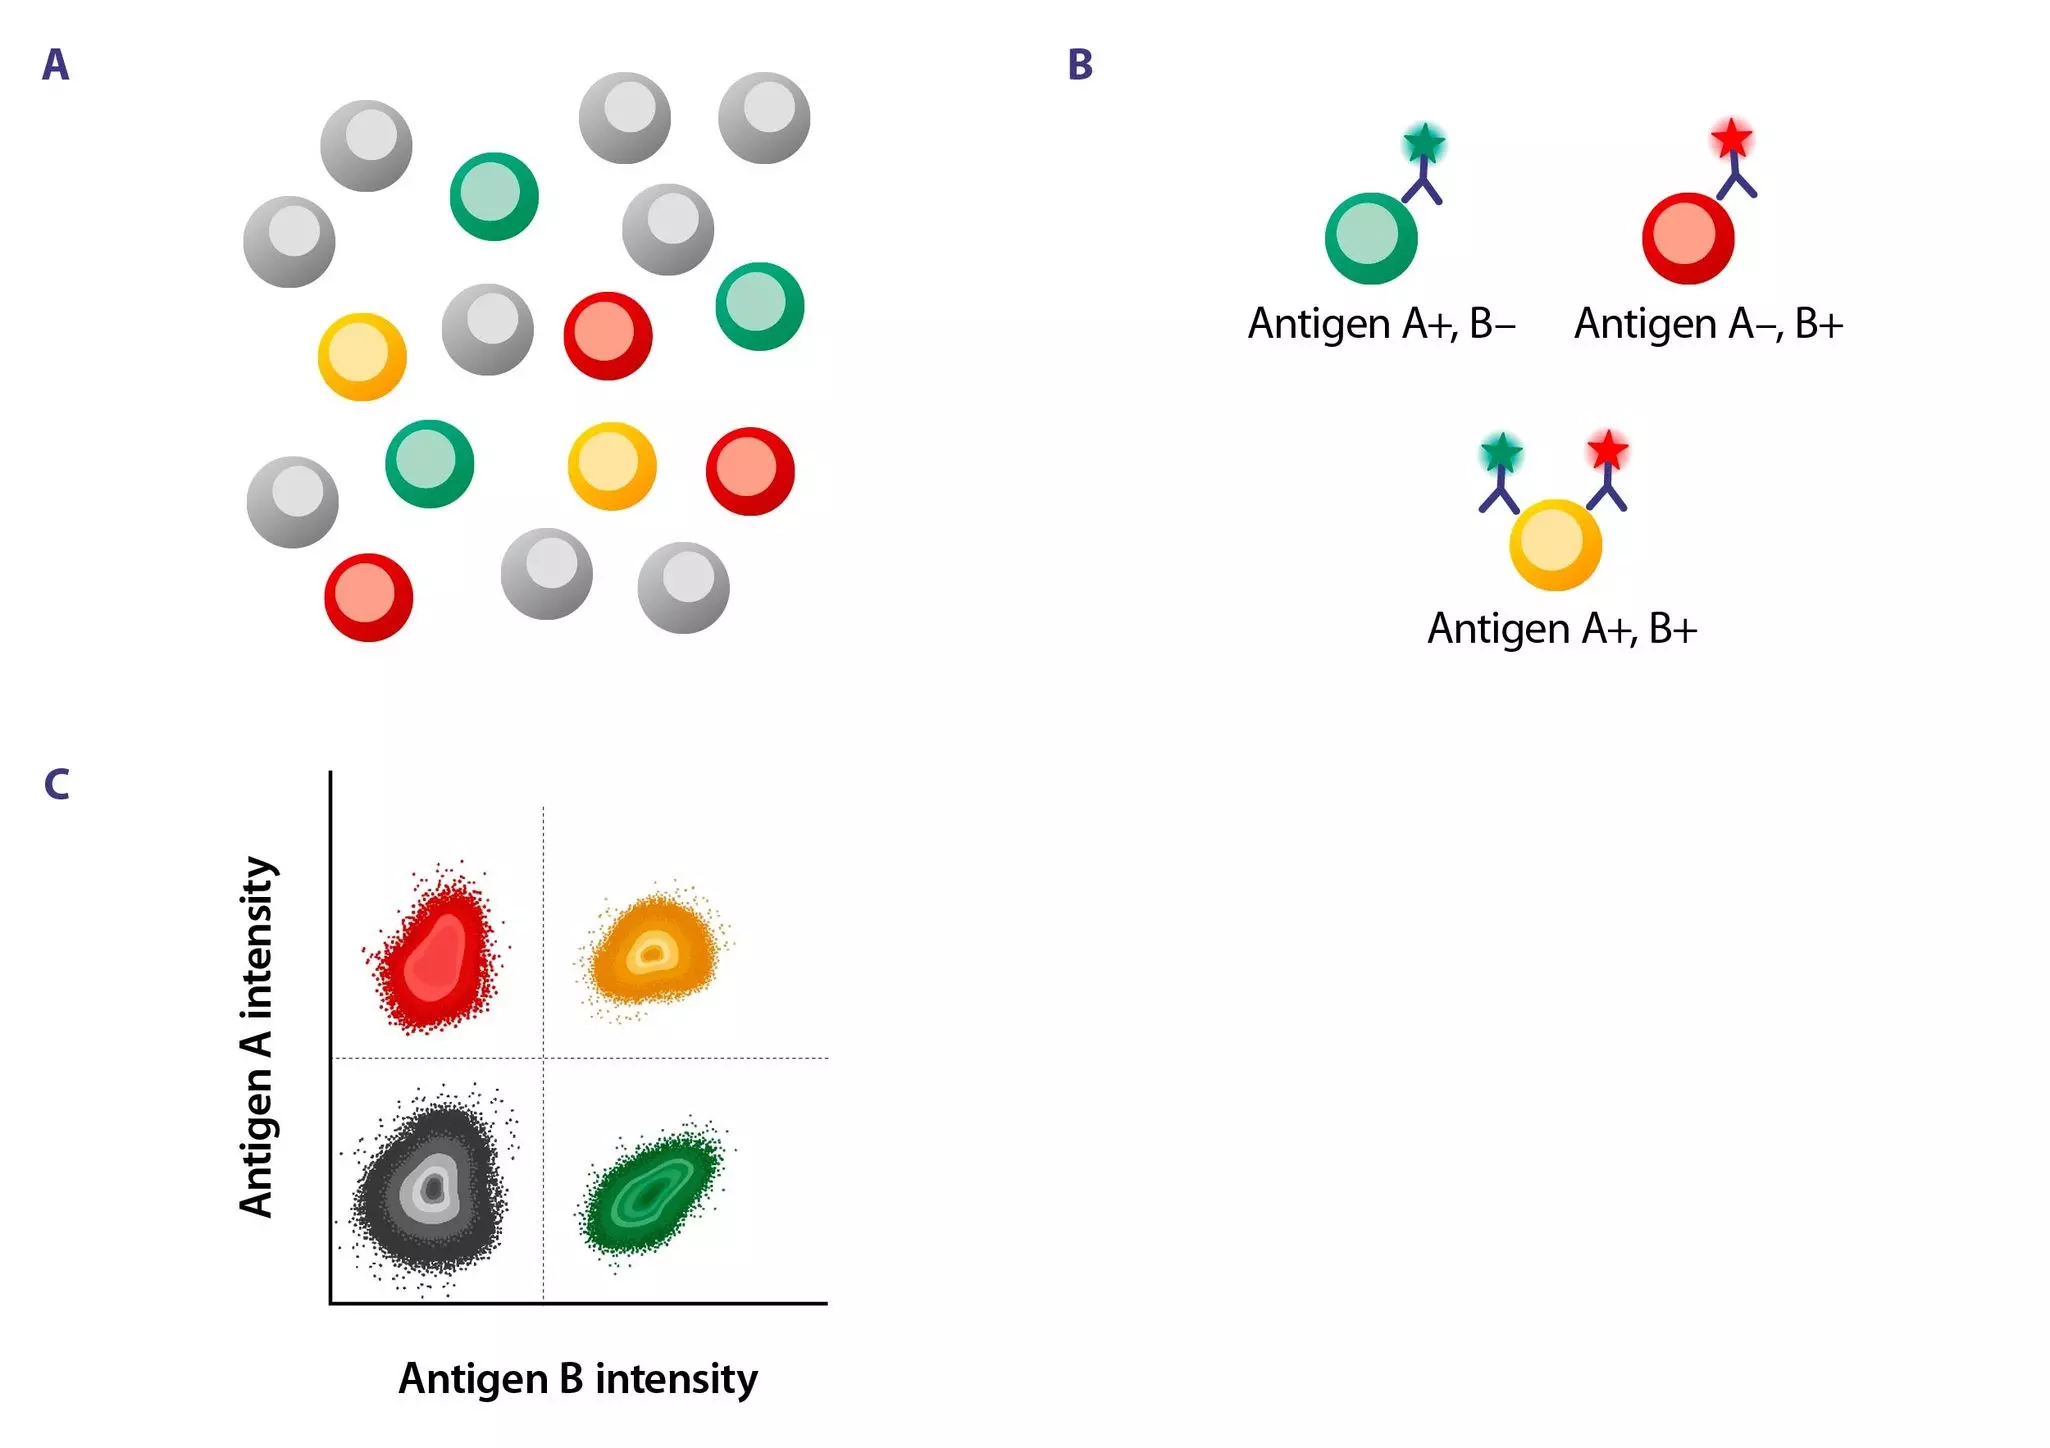
Schematic overview of a gating strategy: Different cell types are labeled in gray, green, yellow, or red. B. The green cell carries antigen A but not antigen B and is labeled with an antibody that recognizes antigen A. The red cell carries antigen B but not antigen A and is labeled with an antibody that recognizes antigen B. The yellow cell carries antigens A and B and is labeled with an antibody that recognizes antigen A and another antibody that recognizes antigen B.
C. Dot plot showing antigen A versus antigen B intensity separated into four quadrants. The lower left quadrant displays all negative cells (gray), the upper left quadrant shows all red cells (high intensity of antigen A), the lower right quadrant shows all green cells (high intensity of antigen B), and the upper right quadrant shows all yellow cells (high intensity of antigens A and B).
Establishing gating strategies in flow cytometry

The laser and detector setup of your flow cytometer should guide your choice of fluorophore. Here are some essential tips to help you choose the right fluorophore for each marker:

  • Use bright fluorophores (such as Vio® Bright B515, PE, or APC) for low-expression markers (e.g., PD-1 or CD25) or low-frequency cell populations.
  • Use dim fluorophores (like VioGreen™, FITC, or Pacific Blue) for high-expression markers (e.g., CD45, CD3, CD20) or high-frequency cell populations.
  • If you are performing intracellular staining or require fixation, try to avoid tandem dyes (PE-Cy7, PE-Cy5.5, APC-Cy7, etc.), as they are highly sensitive to fixation and permeabilization. If they are required for your assay, keep the fix/perm timing as short and mild as possible.
  • Avoid spectral overlap by choosing fluorochromes with minimal emission spillover, especially when working with co-expressed markers. Not sure about the spectral overlap of your fluorochromes? Check out our fluorophore guide below for a list of incompatible fluorophores.
  • Think about your gating strategy in advance. If you plan to identify a specific double-positive cell population (e.g., CD3+CD8+ double-positive T cells) using biaxial gating of two markers against each other, select colors from different lasers for these two markers to minimize compensation dimensions.

Tip 4: Check for spectral overlap and compensation needs

This is a schematic overview of spectral spillover in flow cytometry before and after compensation, using FITC and PE as an example of spectral overlap. The dot plot shows the common banana-shaped population before compensation and the straight alignment after compensation. Additionally, the PE-Cy7 compensation shows the error of the spillover spreading after compensation.
A separate table explains the impact of spectral spillover on data.
Spectral spillover and compensation in flow cytometry

Spectrally similar dyes are fluorochromes with overlapping emission spectra. This means their fluorescence signals can "bleed" into each other’s detection channels, which can distort your data. Use a spectra viewer, such as the Fluorescence spectra viewer, to visualize emission profiles and minimize overlap.

Don't forget to prepare for compensation:

  • Use single-stain controls of cells or compensation beads for each fluorophore. These must be stained individually using the same antibodies and fluorophores as in your full panel. It is used to measure the spillover of that fluorophore into other detection channels and calculate a compensation matrix.
  • Include unstained controls for background correction. An unstained control contains the same cell type or sample as your experimental samples, but does not contain fluorescent antibodies, viability dyes, or nuclear stains. It shows how much background fluorescence your sample emits naturally.
  • Generate proper compensation matrices before acquiring your actual samples. A compensation matrix shows the percentage of signal from each fluorochrome that spills into each channel. Ideally, the less compensation, the better. However, high compensation is not inherently bad: panels with high compensation can still work fine if the markers are bright and populations are well resolved (e.g., by distribution of dyes displaying high spillover on different cellular subsets/lineages). The most important factor is the spillover spreading error (SSE), not the compensation percentage itself. SSE is the increase in variability, or "spread," of a negative population in a detector caused by compensating for spectral overlap from other fluorophores. This is often called the "trumpet effect." SSE reduces the ability to distinguish dim positive cells from negatives, even after compensation. High compensation can increase SSE in flow cytometers that rely on photomultiplier tubes (PMTs) for detection of low-energy emission wavelengths, for example, in the red and near-infrared (NIR) range. This SSE can reduce the ability to separate dim populations.
  • Lastly, although using beads can often be an efficient way to perform compensation, you should test your panel on biologically relevant cell samples before starting your main experiment. This extra step can help you uncover unexpected issues early and save you time, reagents, and frustration down the line.

Read more about compensation in Szalóki G, Goda K. (2015), Cytometry A 87(11):982-5, and Roederer M. (2001), Cytometry 1;45(3):194-205 to see the full picture.
Would you rather understand the PMTs of a flow cytometer? Then take a look at Lawrence, William et al. (2008). A comparison of avalanche photodiode and photomultiplier tube detectors for flow cytometry. Progress in Biomedical Optics and Imaging - Proceedings of SPIE. 6859. 68590M-68590M.
If you want to dive into the basics of flow cytometry, check out our MACS Handbook and become an expert!

Tip 5: Optimize your signal resolution by titration

Schematic overview histograms explaining antibody titration of FITC: A. Optimal titer with great separation of positive and negative populations. B. Too much antibody with spreading of the negative population. C. Too little antibody with a dim positive population.
Antibody titration in flow cytometry

Even the best flow cytometry panel won't perform well without careful optimization. Here’s how to validate:

  • Titrate antibodies to determine the optimal signal-to-noise ratio, or Stain Index (SI). Avoid the default concentrations and run a dilution series. Using too little antibody results in weak staining and overlapping positive and negative peaks. Too much increases background, spillover, and peak broadening. At the optimal titer, the positive and negative populations are clearly separated with minimal spread. This enables cleaner gates and more reliable results.
  • Voltage titration, also known as "voltration," determines the ideal voltage for a photomultiplier tube (PMT) in flow cytometry. This process involves running a stained sample at various voltages for each detector and selecting the setting that maximizes the SI. This ensures clear signal separation without saturation or excess noise.

Read more about antibody titration in Bonillia, D. L. et al. (2024), Cells 13(20), 1677.

Tip 6: Select suitable controls for your flow cytometry panel

  • Use fluorescence minus one (FMO) controls to set accurate gates, especially for dim, rare, or highly autofluorescent markers. An FMO control contains all the fluorophores in your panel except one. This allows you to see the background signal (spillover and autofluorescence) when a particular fluorophore is absent. FMOs are only necessary for critical or ambiguous markers.
  • Include isotype controls to identify non-specific binding, especially in samples with high background, such as tumor tissue. Isotype controls are matched to your test antibodies in terms of species, isotype (e.g., IgG1 or IgG2a), and fluorochrome. However, they do not recognize any target antigen in your sample. They mimic non-specific interactions, such as Fc receptor binding, sticky interactions, and background fluorescence from autofluorescent cells.
  • Add Fc receptor blocking reagents or use engineered antibodies that reduce Fc receptor binding.
    Monocytes, macrophages, and dendritic cells express Fc receptors that bind to the Fc region of antibodies. This results in non-specific signals and false positives. Adding Fc receptor blocking reagents (e.g., FcR Blocking Reagent, Human) can prevent this interaction. Alternatively, REAfinity® Recombinant Antibodies have modified Fc regions that minimize Fcγ-mediated binding. This reduces background and improves staining specificity in complex samples.

Overview of experimental controls.

Control typeContains antibodies?Purpose
FMOAll but oneHelps define gating for that one
UnstainedNoneChecks for autofluorescence
IsotypeNon-targeting antibodyDetects non-specific binding
Single-stainOne fluorochromeCompensation setup

Looking for more tips or premade panels? We can help!

You have previously chosen International as your location.
What do you want to do?